Introduction
The idea with ManagerSheet is to analyse an investment portfolio, and to provide a condensed, but still profound, view of the portfolio manager's performance/risk/investment style on one single sheet of paper (the output is a one-page pdf-file), and thereof the name ManagerSheet.
The idea is to go beyond traditional performance and risk measures, and in addition reveal and highlight the origins of perfomance and risk, and all of this in one single page. And why use just one single page, one might ask. The answer is simply because that is in general as much as people tend to be happy to read, e.g. on the internet and in sales meetings etc.
On one single sheet ManagerSheet goes beyond what is traditionally covered in investment portfolio reports, and in addition provides an unbiased view of properties like e.g. style drift and trading contribution, which is crucial information both for an investor, but also for the manager himself, but nevertheless, this kind of information that tells what the manager is actually doing is rarely covered in portfolio/fund reports, not even in reports extending over many pages. Many times an interview with the manager is required to get hold of this kind of important information, but even then it might be difficult to get an unbiased view.
A real world example of usage of ManagerSheet can be found at www.cashderivatives.se.
The project is currently in alpha state, and only limited documentation is currently available. However, in order to try to help enthusiasts and potential early adopters, a brief description of the ManagerSheet report concept as well as the usage of the ManagerSheet Open Source software (i.e. the implementation the same concept) is provided here below.
Feedback is always welcome, and then preferably via Twitter  @managersheet.
Portfolio Report Concept
The concept is preferably explained by descriptions of each and every chart as follows.
| Chart Descriptions | |
|---|---|
| Chart | Description |
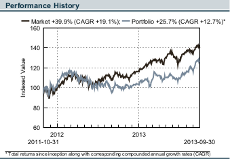 |
A basic performance/risk overview along with key return figures. |
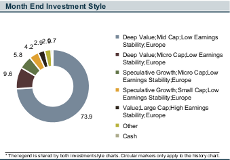 |
Month end investment style in terms of allocations and exposures condensed in one chart, and as it is explained below, the condensed view actually contains important information that would be lost if the information was spread out on different charts.
In priciple one could define any catagories according to personal preferences, but what is important to note here is how catagories (e.g. "Deep Value; Low Earnings Stability; Mid Cap; Europe") are constructed in ManagerSheet out from sub-categories in relation to different properties (i.e. [i] Deep Value, [ii] Low Earnings Stability, [iii] Mid Cap, [iv] Europe in this example). One alternative would be to have one chart for each and every property, which is an approach often seen elsewhere. However, in such an approach one misses out important information about the relationships between allocations to different sub-categories in relation to different properties, therefore categories in ManagerSheet are constructed based on all sub-categories in relation to all propoerties. Let us illustrate this with an example, and let us assume that some part of our portfolio is allocated to value stocks. Then it is important to know in what region we own value stocks, this because valuations typically vary between different regions because of how various inherent risks (legal risks, political risks etc.) are perceived by the market. If we instead had had one valuation chart and one region chart, then we had misses out some of the background to why these stocks are value stocks. Here follows an example on how categories can be defined for a stocks portfolio. Investment style sub-categories are here determined by the following properties, valuation, market cap, earnings stability, and domicile. Valuation categorization is based the product |
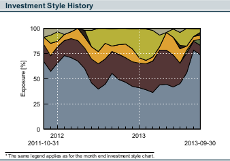 |
The development over time of the investment style according to above.
|
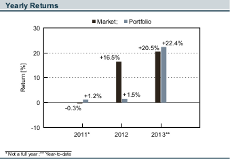 |
The yearly returns, no more, no less. |
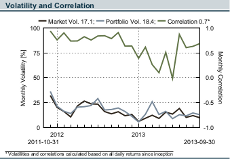 |
Volatility and correlation per each month, along with the volatility and correlation since inception.
The per month graph can reveal information as for example the correlation in different market environments, and if the portfolio experience similar volatility as the benchmark in different market environments. |
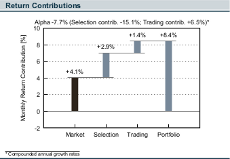 |
Trading is the sum of P/L of trades closed during the month, where a trade is defined as a buy/sell that is closed with a corresponding sell/buy within 63 business days.
Selection is implied by (i) Trading, and (ii) the market performance (Market), and (iii) the portfolio performance (Portfolio) during the month as follows.
|
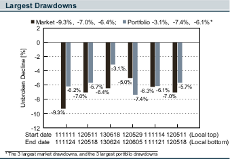 |
Here a drawdown is defined as the distance (in percentage decline in value) between a local top and an adjacent local bottom, where a local top is a day with positive return followed by a day with negative return, and a local bottom is a day with negative return followed by a day with postive return. |
Software Download, Installation, Usage
ManagerSheet is developed on Debian Linux running in Virtualbox on a Windows platform, and if one runs into trouble on some other platform it might be worth trying Linux in Virtualbox, which supports most operating systems.
Feedback on any problems experienced when trying to download and install and trying to run ManagerSheet is always welcome, and then preferably via Twitter @managersheet.
| ▪ | Download the file mnsh-version-[latest version].tar.gz from |
| ▪ | Execute the Python-script run_mnsh.py which is found in the src-directory. This assumes that Python is already installed along with the following Python-modules: apsw, reportlab, xlrd |
At this point data must be imported in order to create any report. The following steps will import a couple of test-files available in the src-directory. The content in these files has no financial relevance whatsoever, and these files are only constructed for the purpose of testing functionality. Anyway, these files are enough for creating a report, and one can inspect these files, and create corresponding files with one's own data in order to create one's own reports.
| ▪ | Import the file mnsh_test_instruments.csv with Instruments/Indices -> Import from File |
| ▪ | Import the file mnsh_test_market_data.csv with Data -> Market Data File Import |
| ▪ | Import the file mnsh_test_investment_styles.csv with Data -> Investment Styles File Import |
In order to continue with imports of portfolio specific information, such as positions and transactions, a portfolio must be created.
| ▪ | Create a portfolio with Portfolios -> New Main and make the following selections in the dialog: Pick any name, e.g. "Test Portfolio"; Leave key facts blank; Set the inception date to 2012-12-28; Select the only possible base currency, i.e. AAA; Select the only possible benchmark, i.e. Index A; Select any color scheme. |
| ▪ | Answer "Yes" on the question whether you wish to initiate the new portfolio with positions and/or transactions. |
| ▪ | In the Import Transactions and Positions from File dialog select the following files: Transactions file mnsh_test_transactions_130131.csv; Positions file mnsh_test_positions_130131.csv, and set the positions date to 2013-01-31. |
| ▪ | Import further transactions with Transactions -> Import from File. The portfolio to be selected in this dialog is the one we created above, and the transaction file to select is mnsh_test_transactions.csv. |
Now we are set to create portfolio reports.
| ▪ | Create a portfolio report for any month, Jan 2013, Feb 2013, Mar 2013, Apr 2013, May 2013, with Report -> Create. |
Now a portfolio report with the name report.pdf has been created, and can be found in the src-directory.